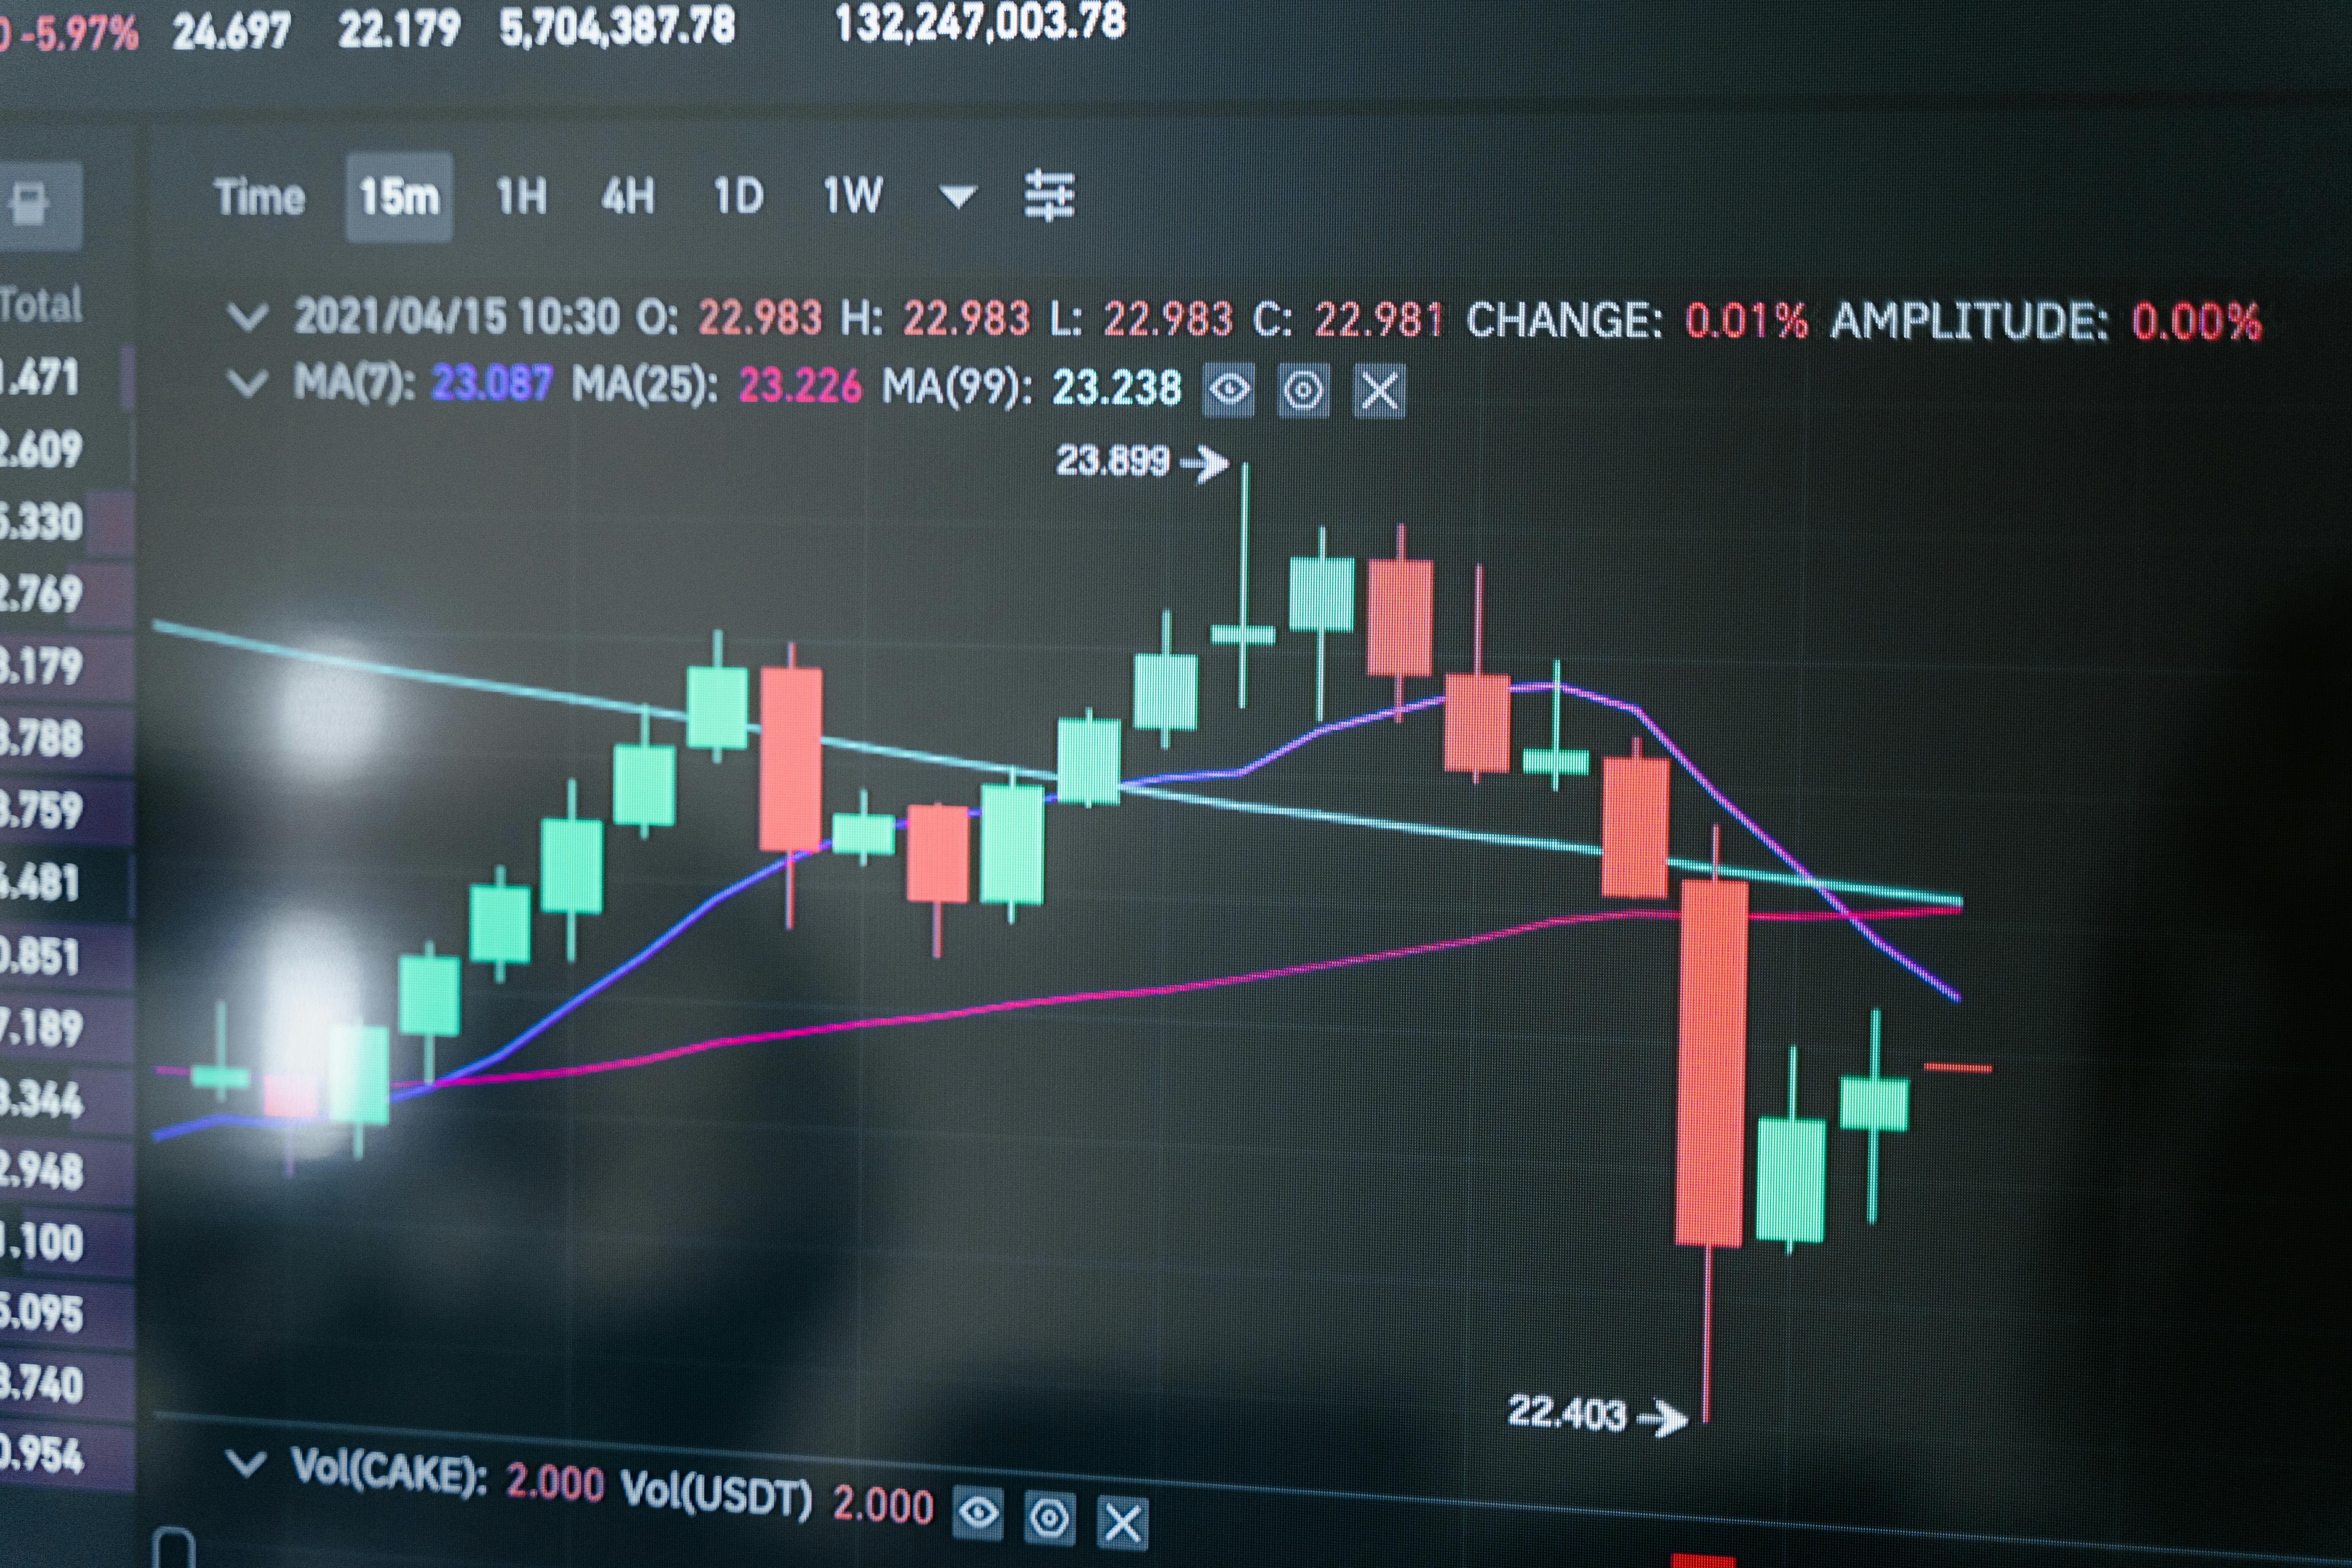
Market Insight : NVDA - Nvidia Shares Soar 5% Amid U.S.-China Trade Truce: A New Era for Chip Stocks?
Market Insight : NVDA - Nvidia Shares Soar 5% Amid U.S.-China Trade Truce: A New Era for Chip Stocks?

Company Overview
Nvidia Corporation (NVDA) is a leading American technology company specializing in graphics processing units (GPUs) and semiconductor technologies that power gaming, professional visualization, data centers, and automotive markets.
Technical Indicator Breakdown and Analysis (as of 2025-05-12)
- EMA12: 114.37662 – The 12-day Exponential Moving Average reflects recent short-term price trends and helps smooth out volatility.
- EMA26: 112.088123 – The 26-day Exponential Moving Average indicates a longer-term trend perspective compared to EMA12.
- MACD: 2.28850 – The Moving Average Convergence Divergence value suggests a bullish momentum as the MACD is positive.
- RSI: 64.42708 – The Relative Strength Index near 64 indicates moderately strong buying pressure but not yet overbought (RSI).
- Price Volume: 10,506,544 – The higher trading volume suggests robust market interest and liquidity.
- Close Price: 123 – Closing price shows a healthy gain compared to previous close.
- Price Change: 6.35 – This positive price change indicates strong upward price movement during the session.
- Percent Change: 5.4436% – A notable daily price increase signaling bullish sentiment.
- High Price: 123 – The day's highest trading price reflects strong buyer dominance.
- Low Price: 120.28 – The day’s lowest price shows price support levels.
- Open Price: 121.97 – The opening price positioned near the low suggests initial selling resistance was overcome.
- Previous Close: 116.65 – Reference for the stock’s prior day close demonstrating price jump.
- Bollinger Band Upper: 122.92110 – Indicates the upper volatility boundary the stock price just surpassed.
- Bollinger Band Middle: 109.95300 – The simple moving average midpoint shows an overall upward price trend.
- Bollinger Band Lower: 96.98490 – The lower boundary reflects major support levels.
- ATR: 5.35938 – The Average True Range suggests moderate volatility and price movement range (ATR).
- Stochastic Oscillator Slow %K: 100 – Indicates the stock is in an overbought condition, potentially signaling an imminent pullback.
- Stochastic Oscillator Slow %D: 94.99086 – Confirms the strong upward momentum but nearing exhaustion.
The technical indicators collectively suggest a bullish trend for NVDA, supported by rising EMAs, positive MACD, and strong price performance above the upper Bollinger Band. However, the elevated RSI and stochastic oscillator warn of a possible near-term consolidation or correction.
Trend Sentiment: ▲ Bullish
Analyst Recommendation Trends
Strong Buy: 24
Buy: 37
Hold: 8
Sell: 1
Strong Sell: 0
The analyst sentiment is overwhelmingly bullish with a strong majority recommending to buy or strong buy NVDA stock. Minimal sell-side opinions further affirm market confidence in Nvidia's growth potential.
Sentiment from Recent News

Overall Sentiment: Bullish
Following the U.S.-China agreement to a 90-day tariff rollback, Nvidia's shares surged over 5% reflecting positive market reception. The easing trade tensions are expected to relieve supply chain constraints, improve demand outlooks, and reduce recession risks, particularly benefiting chip manufacturers and related sectors.
Market Impact from Sentiment News
The recent tariff truce between the U.S. and China serves as a catalyst for Nvidia's bullish momentum, reaffirming investor optimism about growth prospects and supply stability in semiconductor markets. This development is likely to contribute to sustained buying activity and favorable market perception across chip stocks generally.
Summary

The recent 5% surge in NVDA shares driven by the U.S.-China trade truce positively impacts the company's market perception. Coupled with strong technical indicators such as the EMA, MACD, and volume, as well as overwhelmingly bullish analyst recommendations, Nvidia is poised for continued growth potential. While some technical signals suggest caution for short-term pullbacks, the overall sentiment supports a robust outlook for Nvidia's stock.
This article is for informational purposes only and is not investment advice.

Comments
Post a Comment